There is nothing fancy here, just some common vRNI search queries that I find myself running when giving vRNI demos or performing a virtual network assessment. I wouldn’t consider these tailored towards any specific use case, such as troubleshooting, but more of a general introduction into what vRNI is capable of displaying using its Search feature. It’s a powerful tool and I’m only scratching the surface below. Reference the help menu(just type ‘help’ in the vRNI Search field, the official documentation, or the quick reference guide for even more options.
Keep in mind with most of these searches you will have the option to Filter them down further once the results are show. This a helpful if you need to start at a high level and narrow down the results based on other parameters.
Please Note: Some of these may not return the intended results in your environment as they may depend on specific data sources or configurations being available. For example, several search queries require NSX Firewall or a physical firewall added into vRNI as a data source to pull data from.
Bonus Info:
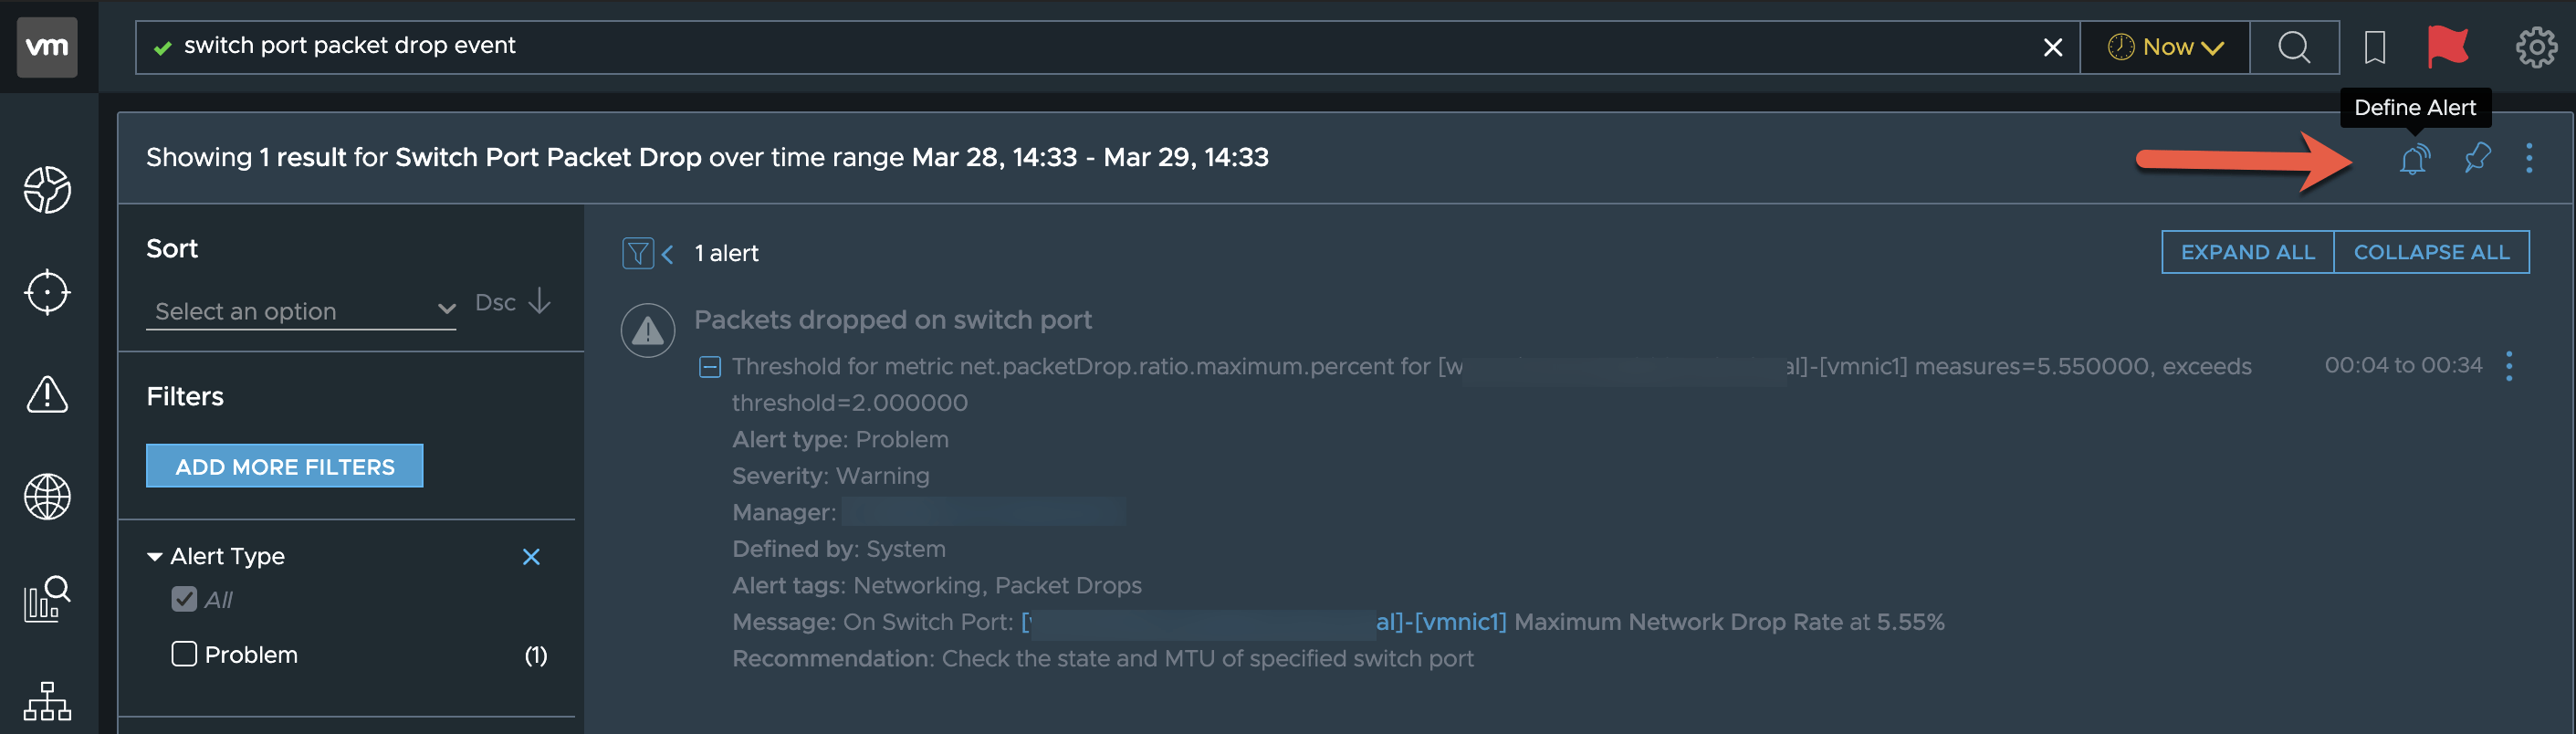
One awesome feature of vRNI is that for almost any search query you can set up a corresponding alert. Shown below for detecting a switch port packet drop event. Simply click on Define Alert and modify any of the provided parameters based on what action you’d like to trigger on. You can find more details on how to use Search-based Alerting here.
Below you’ll find the description of what the search command does in bold text followed by the actual search command in the grey box. Be sure to play around with the searches as many are not limited to exactly what you see listed here. Ex substitute “destination” for “source” or change “7 days” to “1 day”.
General vRNI Searches
These Queries can be a nice starting point to demonstrate the various types of data vRNI is pulling in which only helps paint a better picture of your environment. The more data sources it can see the more detailed you can get. From vCenter details to physician network gear, and even cloud resources.
List the number of VMs per OS type:
vms group by operating system
Get a list of VMs matching a specific OS:
vms where Operating System = ‘Microsoft Windows Server 2019 (64-bit)’
Show me a list of vSphere builds and how many hosts they have:
host group by OS
Show the network rate of all hosts (ordered by the highest)
network rate of host order by Max Network Rate
Show all flows grouped by the destination country:
flow group by destination country
VM Communication Searches
Below are some interesting ways to look at virtual machines and their flows.
Display the communication between two virtual machines(path topology/underlay/path ports/flows/etc):
VMware VM ‘VM01’ to VMware VM ‘VM02’
Display a VM’s path to Internet:
VM01 to Internet
Show the top 10 VMs based on flows to countries outside the United States over the last 7 days:
top 10 flow where Destination Country != ‘United States’ group by Source VM, Destination Country order by sum(Bytes) in last 7 days
Show the top 10 VMs with flows originating outside the United States over the last 7 days.
top 10 flows where source country != ‘United States’ group by destination VMs, source country order by sum(bytes) in last 7 days
Show VMs on a network (vlan or vxlan). You can then use the Filters to narrow your search down further.
vm by VLAN
To take that one further we can add an Outgoing Port to narrow the search.
vm by VLAN where Outgoing Port = 443
Show which network segments have the highest VM count:
vm group by L2 network
Show VMs with a flow incoming over a specific port such as TCP 443:
vm where incoming port = 443
Show the total number of VMs grouped by Firewall Rules:
VMs group by Firewall Rule
Show the flows between VMs and Physical devices in bytes:
flows where Flow type = ‘VM-Physical’ by bytes
Show the VMs that are being affected by a firewall rule:
vm where Firewall Rule = ‘Enter FW Rule Name’
Network Searches
Here we look at the network side of what vRNI is collecting, both from the physical and virtual network components.
List out all networks (vlan or vxlan)
show VLAN
Show the flows where a firewall is configured to deny:
flows where firewall action = deny
Show flows for a specific port
Flow where port = ‘123’
List the top # of VMs with Rx Packet Drops:
Top 5 VMs order by Rx Packet Drops
Show the top 10 VMs by max packet drops
top 10 vms by max packet drops
Show the Switch Ports or Router Interfaces with packet drops and their network rate.
show Max Packet Drops, total packet drop ratio, network Rate of Switch Ports by Total Packet Drop Ratio
Show all network traffic going to the internet:
flows where Flow Type = ‘Source is VM’ and Flow Type = ‘Destination is Internet’ by bytes
Show the total flows in bytes of all traffic coming from the Internet to a VM within the last 7 days:
sum(bytes) of flows where Flow Type = ‘Source is Internet’ and Flow Type = ‘Destination is VM’ by bytes in last 7 days
List the L2 Network Segments with the total flows in sum(bytes).
sum(bytes) of flows group by L2 Network
Look at Internet flows grouped by port with traffic totals:
*This is a great one to change out ‘port’ for some other datacenter variable.
sum(bytes) of flows where Traffic Type = ‘INTERNET_TRAFFIC’ group by port
Similar to the above query let’s search for East/West Traffic by port totals(bytes):
sum(bytes) of flows where Traffic type = ‘EAST_WEST_TRAFFIC’ group by port
Show the top 10 subnets where traffic is remaining within that subnet. *Potentially a good use case for micro-segmentation based on these results. The traffic is E/W and not hitting a classic FW.
top 10 flow where Flow Type = ‘Switched’ group by Subnet Network order by sum(Bytes) in last 7 days
Show the top 10 networks that are routing traffic between subnets based on total bytes in the last 7 days.
top 10 flow where Flow Type = ‘Routed’ group by Source Subnet Network, Destination Subnet Network order by sum(Bytes) in last 7 days
Find switch-ports or router-interface having packet drops:
show Max Packet Drops, total packet drop ratio, network Rate of Switch Ports by Total Packet Drop Ratio
show Max Packet Drops, total packet drop ratio, network Rate of Router Interface by Total Packet Drop Ratio
Show firewall rules where any port or service is being allowed
firewall rule where action = allow and service any = true
View any firewall rules that are being masked by preceding firewall rules, or are potentially redundant.
firewall Rule Masked Alert
View any firewall changes made in the environment:
firewall rule change
If you find other fun searches or an interesting combination of search commands please send them my way. I’m always curious to see what people find most helpful in vRNI. Thanks for reading!